Many times, customers feel like their infrastructures are slow, and they don’t know where to start troubleshooting. In this post, we’ll discuss the key Microsoft Hyper-V performance metrics and how Veeam can help determine and solve the problems with advanced monitoring and reporting capabilities Veeam ONE.
You can also watch the full recording of the session Deep-Dive Performance Analysis for Hyper-V and VMware shown at VeeamON 2015 for more details.
If you use Veeam ONE to monitor your Hyper-V environment, you should first check the Alarms tab to see any currently unresolved alarms. In the picture below, we can see a number of unresolved performance alarms. In the scenario shown, I’m using a standalone Hyper-V host with seven different virtual machines (VMs) running on it.

If you’re not sure where to go from here, I suggest that you begin with the most frequent troublemaker: disk metrics analysis. If the disk performance looks good, you can move on and check memory and then CPU performance.
Disk performance
The most important metrics for monitoring disk performance are Latency, Disk I/O per second and Disk Queue Length. Disk I/O refers to the number of read and write operations that VMs perform on a physical disk. If host disks get more requests than they can fulfil, they move excess requests to a queue. The more time the requests spend in the queue, the bigger the delay is, and end users can really feel the performance problem.
Once you find a triggered performance alarm, you should look at the performance graph. When we click on the host’s summary, we can review all hosts and alarms, including alarms for the VMs running on the host.
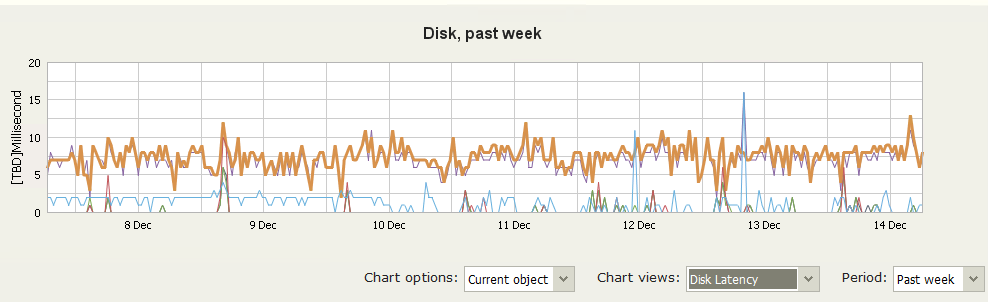
If you see high values occurring during certain intervals only, take note of the type of activity happening during those intervals. Usually, it’s backup jobs, antivirus scanning, defragmentation or something else. However, if the disk performance is constantly high, as observed in our scenario, check the alarms tab for any memory swap alarms. When they are triggered, it means that some VMs have undersized memory, and because of the lack of memory resources, the overhead between memory needed and memory possessed was swapped to the disk. To find out which VMs are undersized, we can run a Veeam ONE report called Undersized VMs. You can also use Hyper-V I/O load balancing on the hypervisor to help distribute resources among VMs.
If you see disk usage spikes at the same time backup jobs run, you can leverage Veeam backup techniques like shared snapshots and hardware VSS provider to make the backup process less I/O intensive. To keep latency below undesired values Veeam Backup & Replication™ has the Storage Latency Control setting, which stops assigning backup tasks and throttles existing ones if the storage latency is high.
Memory performance
The second main thing you should check is memory. Key metrics include Memory Pages, Memory Available and Memory Pressure. Memory Pages shows how often the system uses the hard drive to store memory-associated data. Memory Available indicates the amount of physical memory available for allocation to a process right now, and Memory Pressure is a calculation of how much memory the VM or host wants divided by how much memory the VM or host currently has.
When applications inside a VM want more memory than the VM currently has, the VM tries to get more from the host. If the host can’t fulfill the requests, it starts to swap memory pages to hard drive. If you have insufficient memory, you could see Memory Available close to zero, high use of Memory Pages and Memory Pressure around 100%.
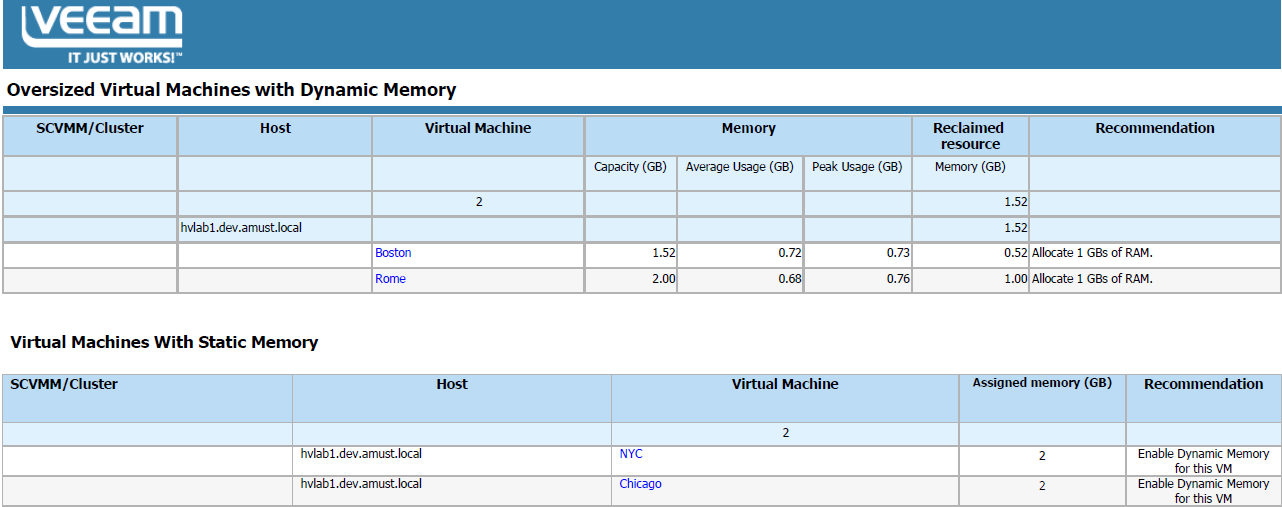
To solve the memory problem, we can find memory that isn’t getting used effectively and free it up for demanding VMs and applications. In other words, you need to optimize memory allocation between VMs. Veeam ONE has a number of new reports to help you optimize your Hyper-V infrastructure, including the Oversized VMs report. Just like we can use the Undersized VMs report to find undersized VMs and get rid of extensive swap, the Oversized VMs report helps us find VMs with excessive memory allocation.
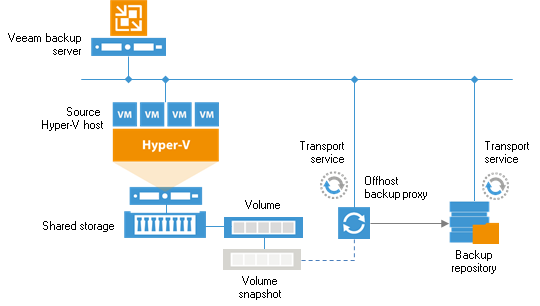
For better performance during the backup process, you should use an off-host backup infrastructure, which shifts the backup and replication load to a dedicated machine, thereby offloading the production Hyper-V host.
CPU performance
Once you finish checking disk and memory performance, you need to take a closer look at CPU. Key metrics to observe are CPU Usage, which shows how loaded logical (host) and virtual (VM) CPUs are, and CPU wait time per dispatch, which tells how much time the virtual CPU waits for the request execution sent to the real CPU.
If you see high CPU usage on the VMs but the host processors are not loaded, you definitely need to check the CPU wait time per dispatch metric and alarm. You may have allocated too many virtual CPUs to your VMs, making it a mess for the hypervisor. The rule of thumb is to set no more than eight virtual CPUs per each logical CPU.
Hyper-V roles unrelated to virtualization can be a troublemaker here. You can leave data deduplication and failover cluster roles on the host, but think twice before doing so if you need anything else. Some of the most CPU devastating procedures are encryption and compression. If you are low on CPU, double-check what you need to encrypt and compress and how often. Once again, pay attention to the Overprovisioned VMs report to see which VMs are oversized by CPU and how many vCPUs you can reclaim. Another helpful report here is Idle VMs, which checks to see if there are any zombie VMs that have their virtual CPUs turned on but barely used.
Automatization
The wonderful news here is that starting with v9, Veeam ONE has two new Hyper-V assessment reports designed to make your life much easier. Hyper-V Performance Assessment report checks the performance of the main metrics and gives you a cutoff for the infrastructure performance. The audit includes the main CPU, memory, disk and network data. The Configuration Assessment report checks to see if any of the most common and most critical misconfigurations are in place, and if so, it shows you how to fix them. The report checks Cluster, Host and VM levels.

Conclusion
In the end, the best practice is to keep an eye on Veeam ONE predefined alarms. When you see an alarm, check the performance history to find out if it’s a recurring issue and take an action to adjust the infrastructure. We’ve seen how Veeam ONE can help you here with various reports. Additionally, remember to run the Configuration and Performance Assessment reports to get a summary of key metrics and to ensure you are using the best Hyper-V configuration practices.
